In the beginning it was difficult to come up with ideas because the brief did not give a specific theme. After reading though it I started collecting various ideas such as themes I could base my topic on, design ideas and different types of research like books, interviews and websites.

Then I choose the theme which I wanted to base my project on namely "COFFEE OR TEA". Everybody has an opinion about rather drinking tea or coffee. It has been a topic for centuries now which made me choose it.
Furthermore I did not want to list serious data about affections or similar topics because those are already designed.
My theme should have a fun part. However, I did not only want to find out about peoples tastes but also use this question to encourage people to donate money for charity.
How does it work?
My idea is to create a charity event which will collect money by selling coffees and teas. The drinks will be counted and in the end the data will be collected and shown as a big projected image on a house front. Because of that the event is going to take place in the evening when it is dark.
On the one side people would have fun going out with friends, would enjoy their coffee and also donate for a good purpose. Basing on the fact that the drink is not going to be expensive students and young adults have also the opportunity for charity.
Afterwards I was pitching as presenting my idea in front of a group and trying to convince them from it. Referring to the feedback that I got my peers liked my ideas and gave me some ideas for developments such as advertising the event with posters and shirts.
Improving on that I thought about designing shirts for each hot drink which people will receive when they buy their cup. This would help to advertise a following event and attract more people.
Furthermore I thought about researching bands and DJ's which would play for free on this event so there would be live music as well.
Furthermore I thought about the reasons for hosting a charity event and what people should spend their money on. Referring to the tea and coffee question I had the idea of donating the money to support Fair Trade which is an important discussed topic, nowadays.
Referring to that I informed myself about Fair Trade.

Furthermore I looked at the company "Clipper" supporting fair trade and decided to donate the collected money to them.
Then I looked at the event's target audience to be able to create an event based on their interests. To have a good overview I brainstormed my ideas in form of a mind map again.

Basing on my audience I did some research on people who enjoy drinking coffee and tea.


Resulting from that I found out that students and young adults are going to be my target audience for this event because they are up for buying coffee and tea as well as like to go out and socialise.
Knowing these facts I sketched several ideas for designing a poster which attracts my audience.
Because the people I am looking at are modernised I used a font which is well readable and simple. The spacing between the words is big enough to be able to read it from a longer distance. To have a clear layout I increased the number of leading so the different verse would not look like one long sentences but instead like bullet points.
The poster colour gives the impression of a sky at night which refers to the fact that the event takes place in the dark.

After I designed and picked the best poster I thought about the locations where to put them. Young people are going shopping, traveling with public transportation and use social media.
Because of that I thought about hanging those posters at bus stops and signs next to shops and stores.


Afterwards I looked at the location where my event could take place. The right place needs to be an area where people could stand, dance and chat as well as the shops could be constructed on. Furthermore it needs to include a building with a big blanc front wall next to it so the animation could be projected on it. "The Green House" at Upper Ground in London is a location including all these facts and therefore the perfect place to host this event. Additinally, it is easy to get there by public transportation which young adults and students mostly use.

Then I looked at my actual chart design and how I want to present it via a projector during the event.
My initial ideas were to use either two bars or points raising up the wall.

To be able to design the charts and before I researched to improve my initial ideas I asked all peers in the Graphic Pathway if they prefer drinking coffee or tea. Each person gets one vote. Obviously, is this research only an example of how the charts are going to look like.
Then I looked at different designs. I liked the idea of having points which would raise from the bottom or dots combined with lines. However, I thought the points are used a lot of times to convey information. Therefore I looked at other examples like lines. I found neon lines which I liked and wanted to convey into two charts.


I looked at different colour palettes just as brown, blue and pink. The brown should convey the coffee chart because it reminds on its colour and the beans. The blue would represent the amount of people drinking tea referring to the hot water which is used making all kinds of flavoured teas. The pink was just an experiment to compare it with the others and decide if it even would be better to use any kind of neon lights.

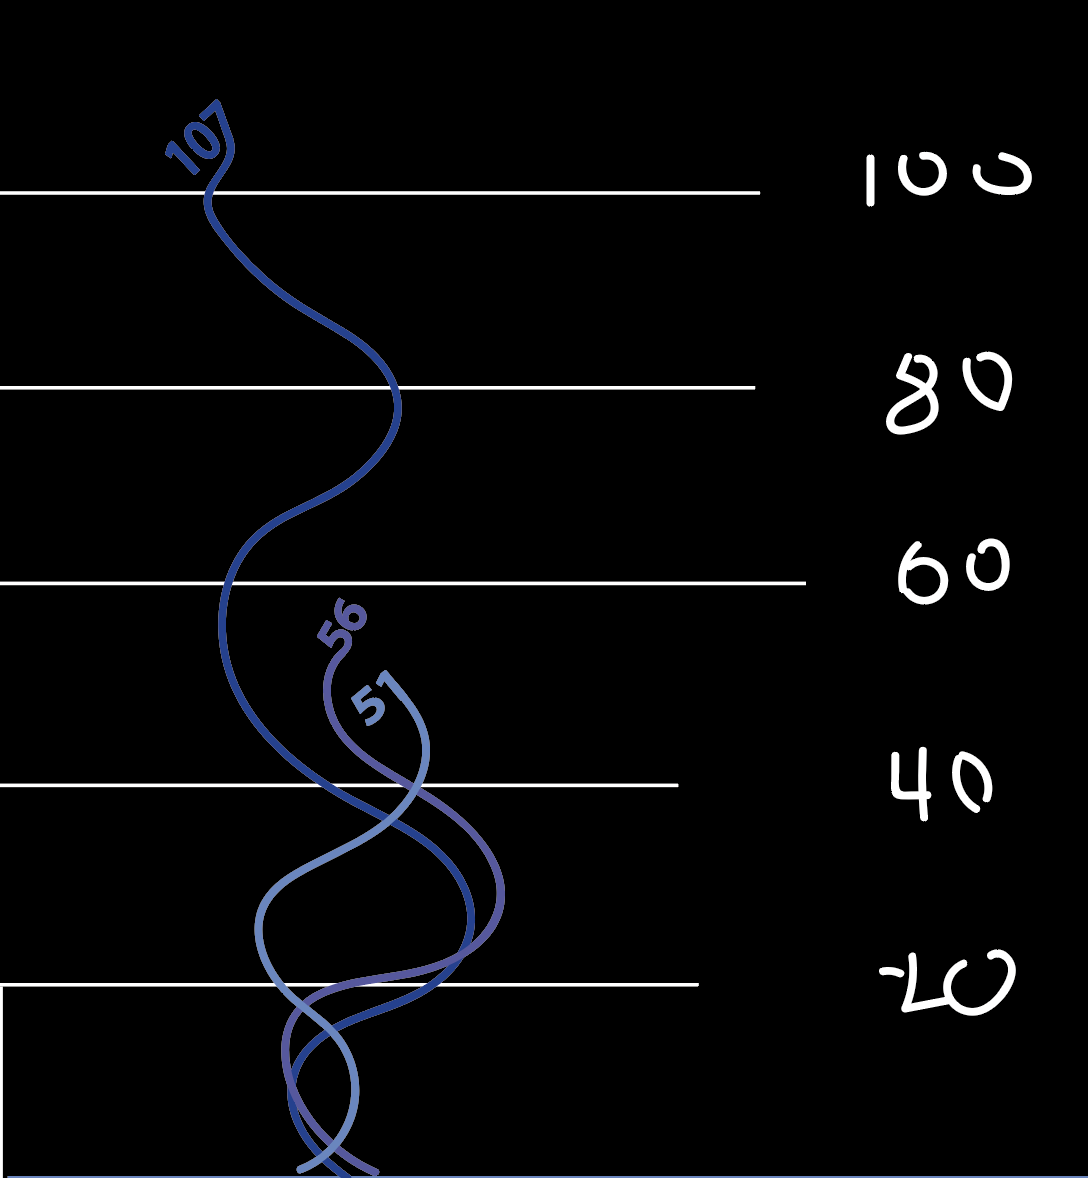
Then I designed the charts formed as lines which refers to the steam of those hot drinks and created an animation via photoshop.
The charts are going to be seen in the evening after people bought a cup of any hot drink so the sold cups could be counted and transferred to the charts.

Because the graphics do not show their topic and which chart represents what drink I decided to add symbols which represent coffee and tea so that even people not knowing the question know the theme of those charts.
Regarding to that I used a curved cup representing the coffee and a squared cup representing the tea. To make it more clear I added a tea bag to the squared cup and coffee beans to the curved one.
Then I improved my animation and photoshopped it into the location where the event is going to take place.
The feedback from my peers was to play more with the layout and movement of the steam and to include more layers and information within the graphics as well as have more references. However, they liked my animation because it was clear and imaginative.
To improve those points I started thinking about what kind of information I could add to my chart but at the same time keep the kind of layout and design.
I started asking 200 people if they rather prefer tea or coffee. At the same time I took notes if they were female or male and in what age group they were in. The different age groups are people under 16, 16 until 21 and persons over 21.
After that I thought about using colour coded lines to convey each information and to include numbers so that the charts would be more specific.
Then I thought about how to explain the different numbers and lines. I decided to go with international symbols so that everybody would be able to understand my informations.


Then I improved my animation.
Kommentare
Kommentar veröffentlichen